Stony Brook University
ESG 332
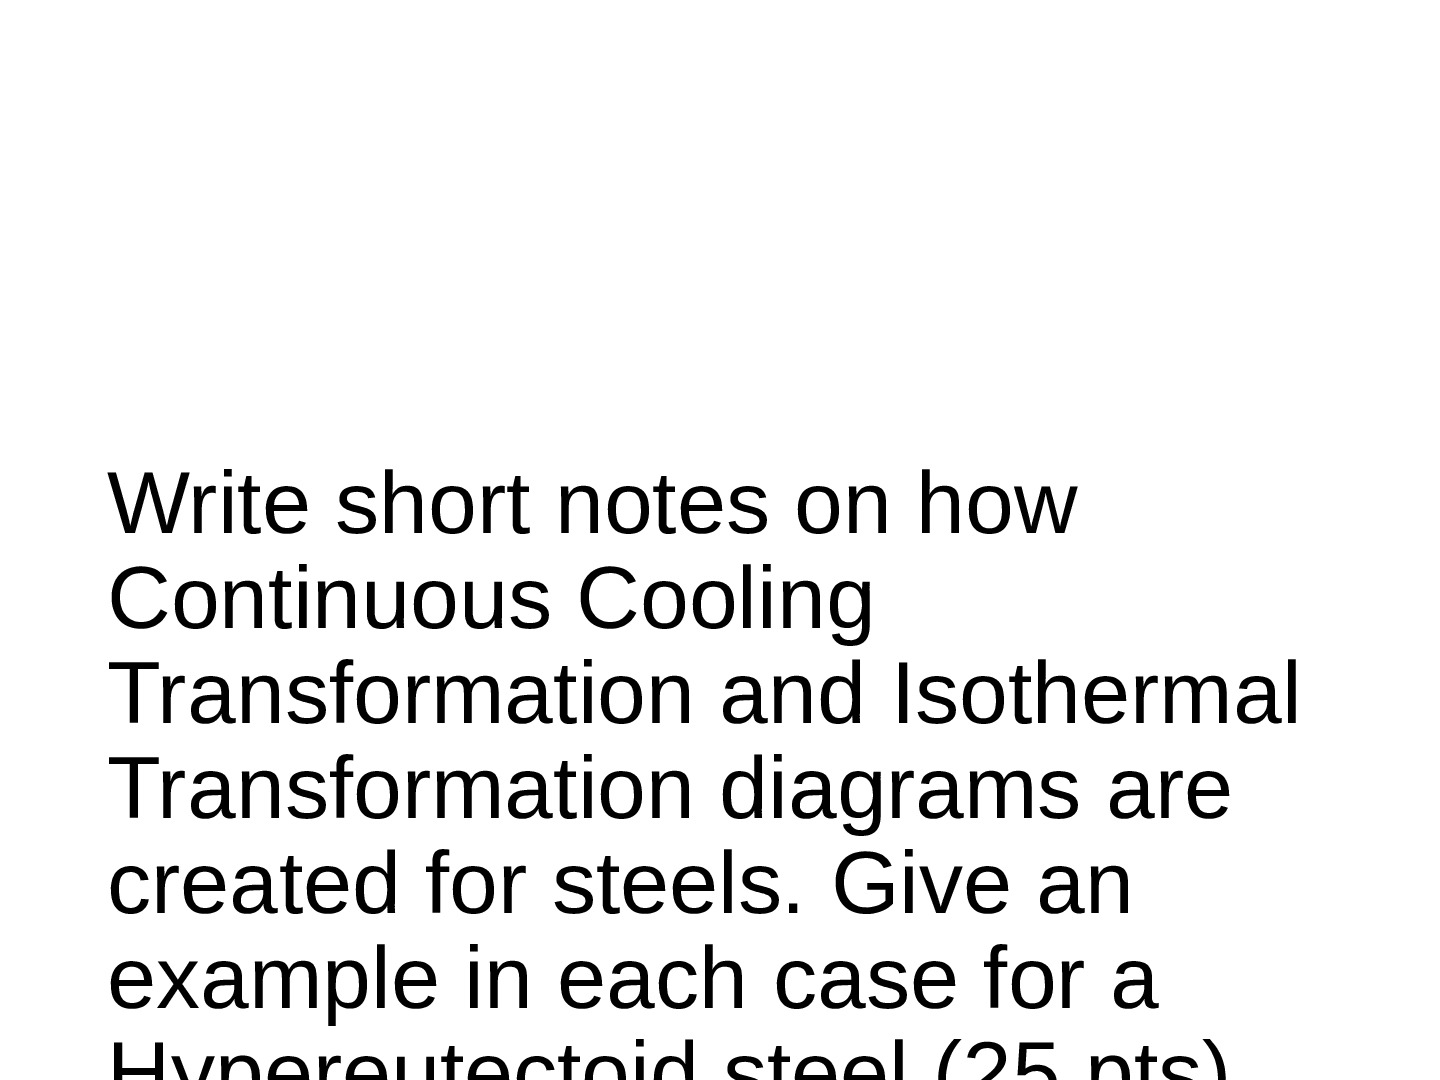
Write short notes on how
Continuous Cooling
Transformation and Isothermal
Transformation diagrams are
created for steels. Give an
example in each case for a
Hypereutectoid steel
Steps to generate an Isothermal Transformation Diagram
1. A series of S-shaped curves of % transformation vs. log of time at different
temperatures is generated
...[Show More]
Write short notes on how
Continuous Cooling
Transformation and Isothermal
Transformation diagrams are
created for steels. Give an
example in each case for a
Hypereutectoid steel
Steps to generate an Isothermal Transformation Diagram
1. A series of S-shaped curves of % transformation vs. log of time at different
temperatures is generated.
1. For each curve, data were collected after rapidly cooling a specimen from a
temperature above the eutectoid temperature (i.e., from 100% austenite) to a
particular temperature. While the temperature remains constant, the fraction of
transformed material (i.e., percent of austenite transformed into pearlite) is measured as
a function of time.
2. On a plot of temperature vs. time, the times and temperatures when transformation
starts, ends, and is at 50% completion are plotted from the data points of the %
transformation vs. log time measurements.
← General picture to
show how an
Isothermal
Transformation
Diagram is made
Isothermal transf
[Show Less]