Remington College, Houston
COM 6414
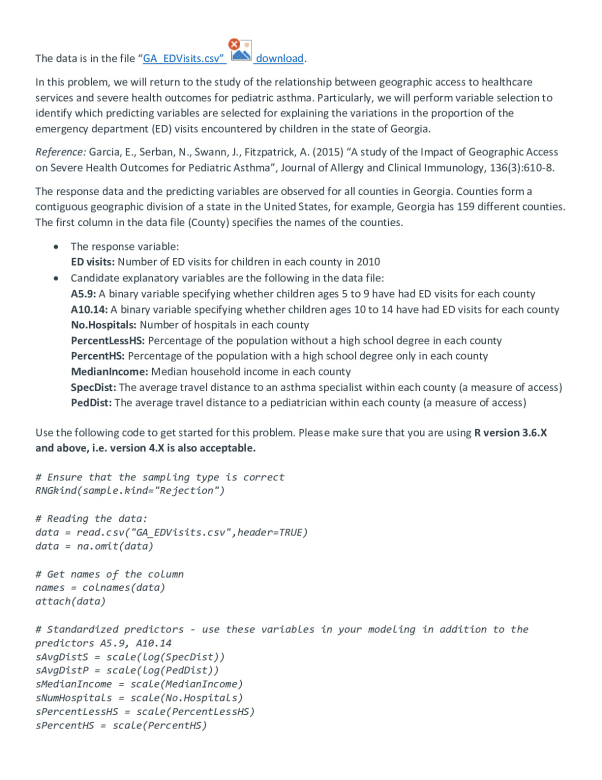
The data is in the file “GA_EDVisits.csv” download. In this problem, we will return to the study of the relationship between geographic access to healthcare services and severe health outcomes for pediatric asthma. Particularly, we will perform variable selection to identify which predicting variables are selected for explaining the v
...[Show More]
The data is in the file “GA_EDVisits.csv” download. In this problem, we will return to the study of the relationship between geographic access to healthcare services and severe health outcomes for pediatric asthma. Particularly, we will perform variable selection to identify which predicting variables are selected for explaining the variations in the proportion of the emergency department (ED) visits encountered by children in the state of Georgia. Reference: Garcia, E., Serban, N., Swann, J., Fitzpatrick, A. (2015) “A study of the Impact of Geographic Access on Severe Health Outcomes for Pediatric Asthma”, Journal of Allergy and Clinical Immunology, 136(3):610-8. The response data and the predicting variables are observed for all counties in Georgia. Counties form a contiguous geographic division of a state in the United States, for example, Georgia has 159 different counties. The first column in the data file (County) specifies the names of the counties. • The response variable: ED visits: Number of ED visits for children in each county in 2010 • Candidate explanatory variables are the following in the data file: A5.9: A binary variable specifying whether children ages 5 to 9 have had ED visits for each county A10.14: A binary variable specifying whether children ages 10 to 14 have had ED visits for each county No.Hospitals: Number of hospitals in each county PercentLessHS: Percentage of the population without a high school degree in each county PercentHS: Percentage of the population with a high school degree only in each county MedianIncome: Median household inco
[Show Less]