Lab Report > Mat 275 MATLAB LAB #1
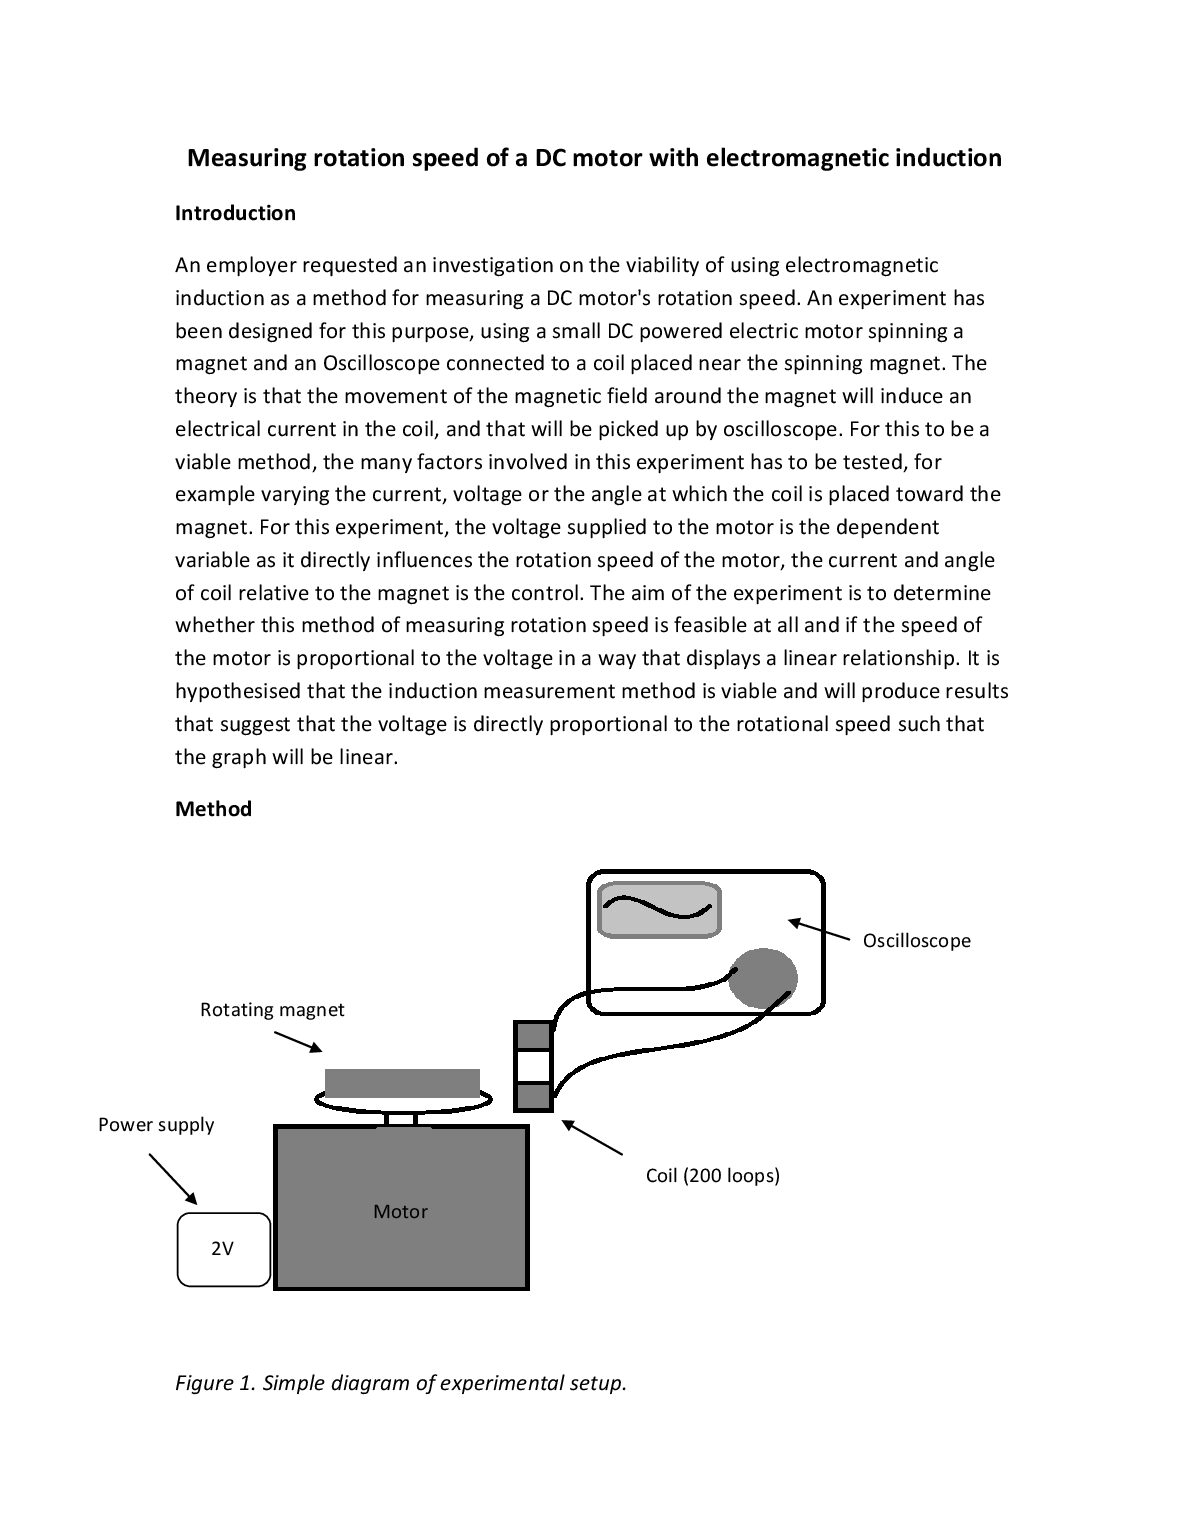
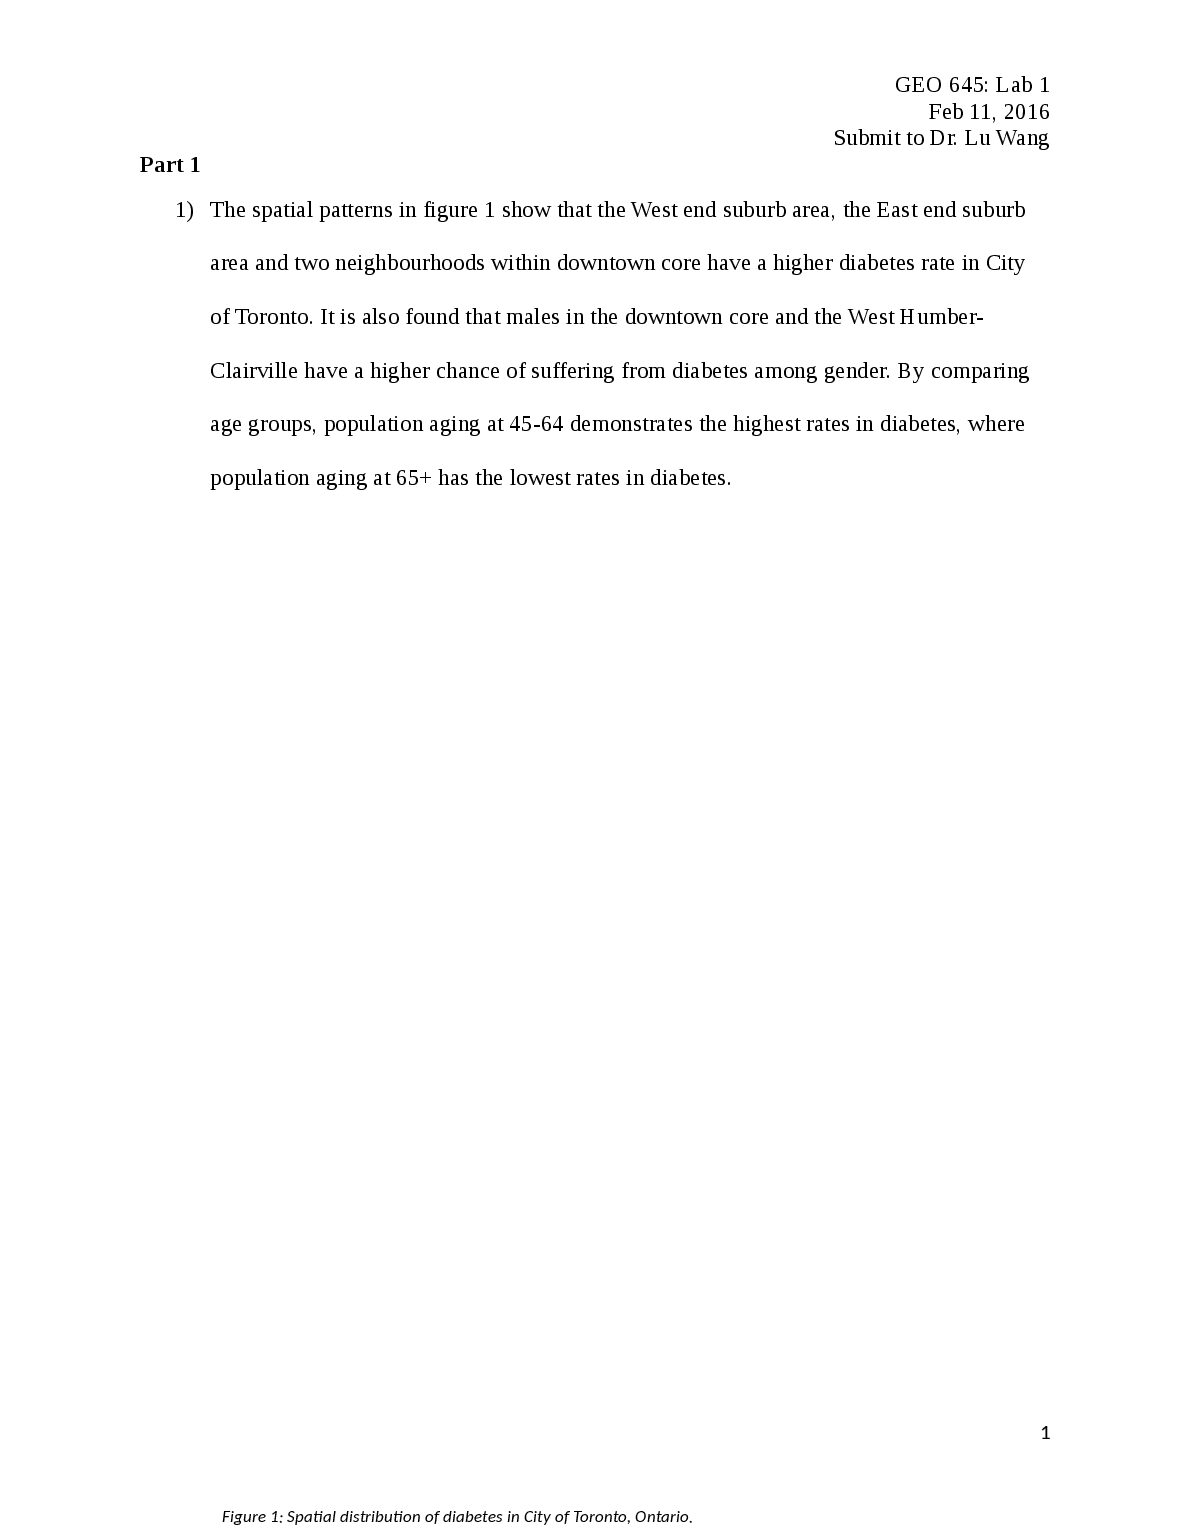
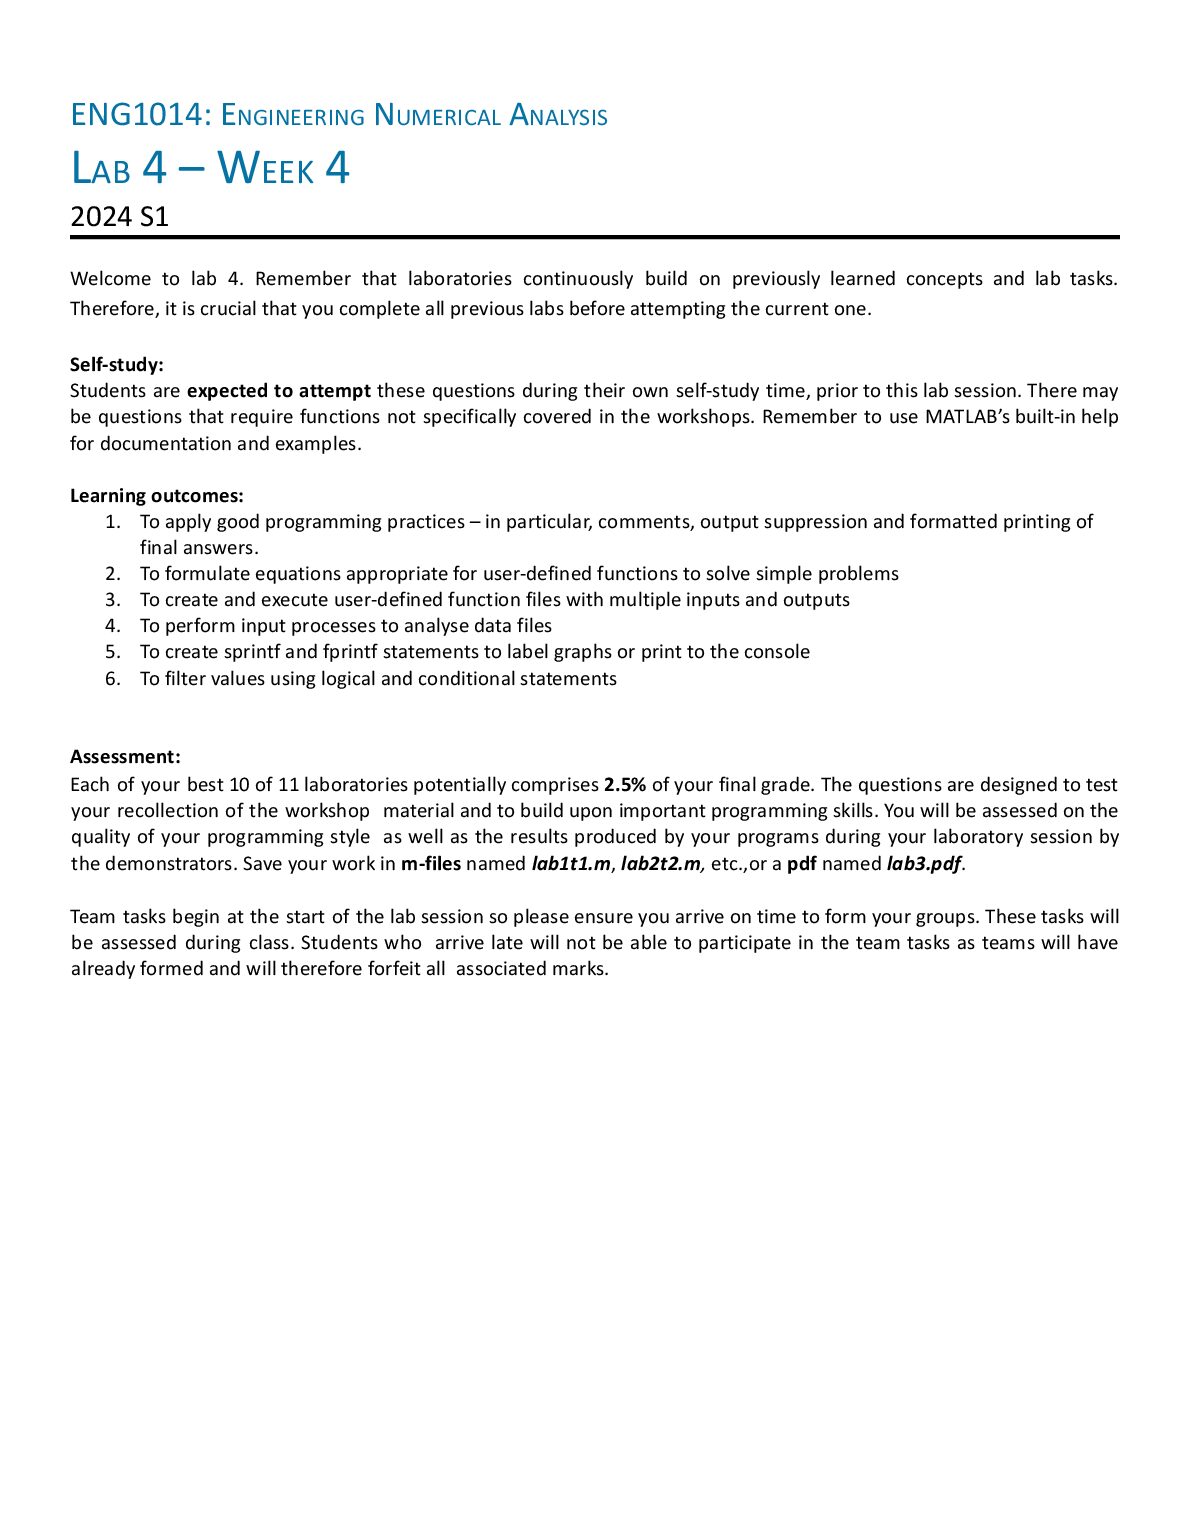
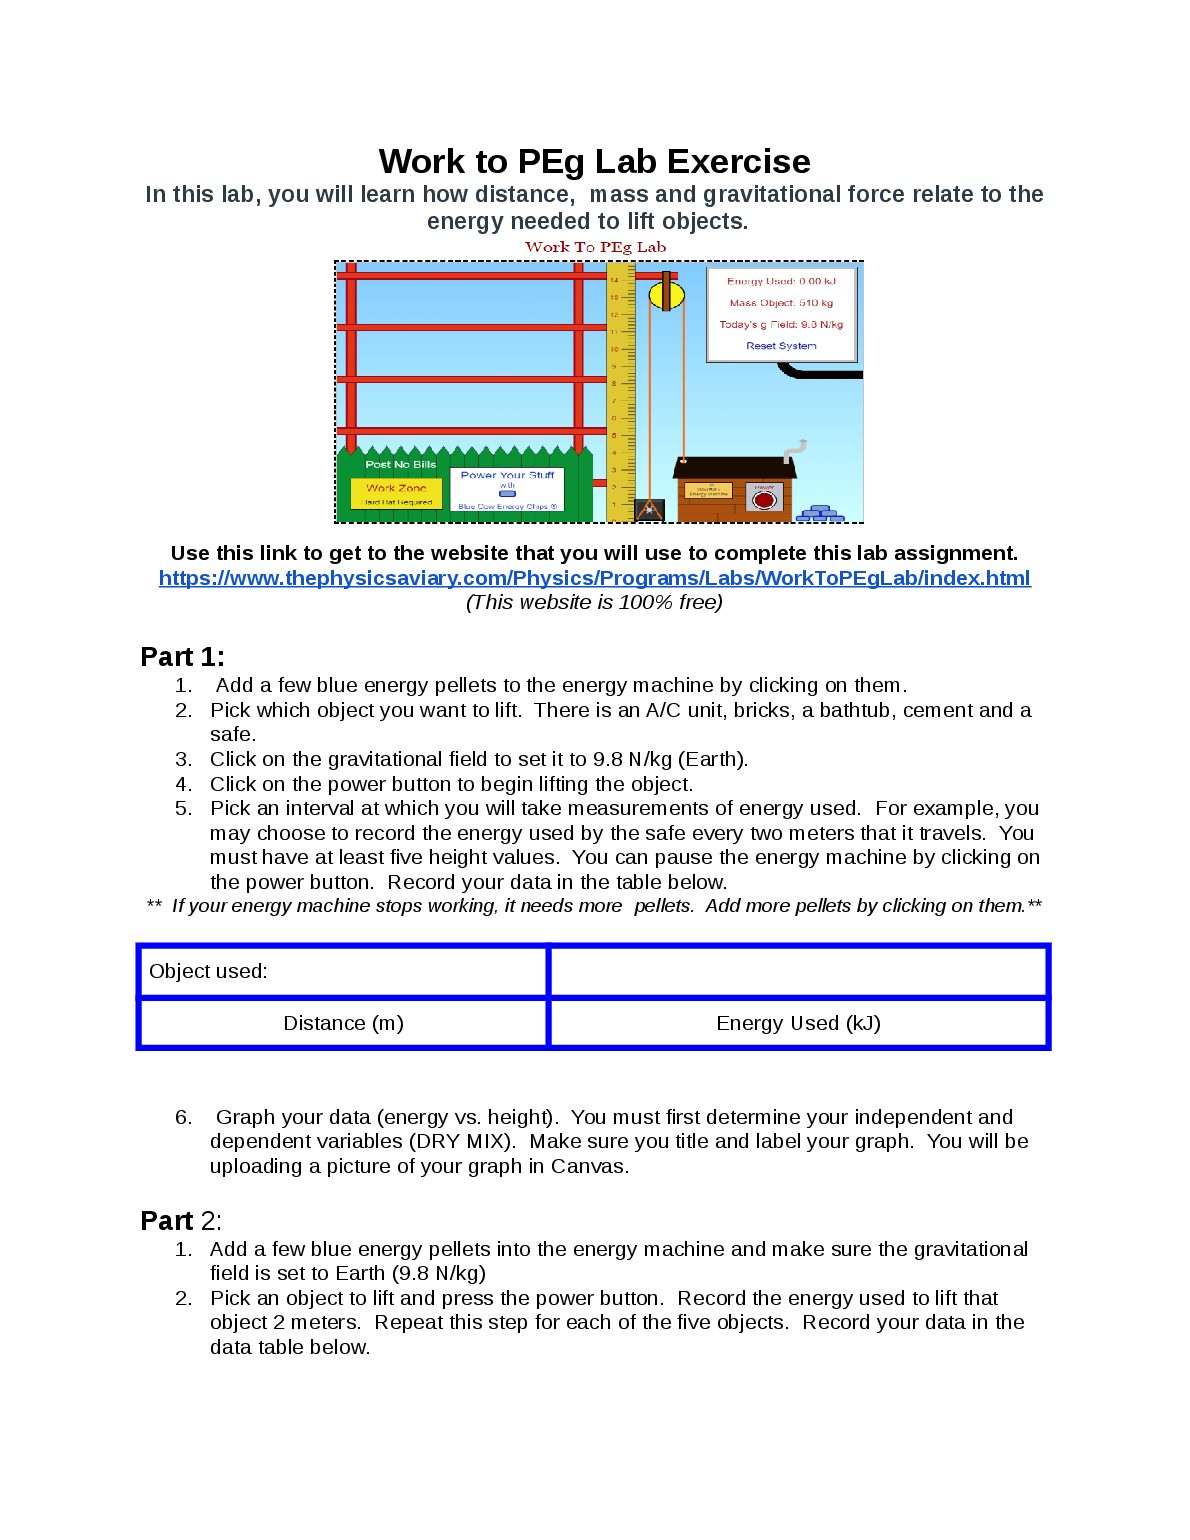
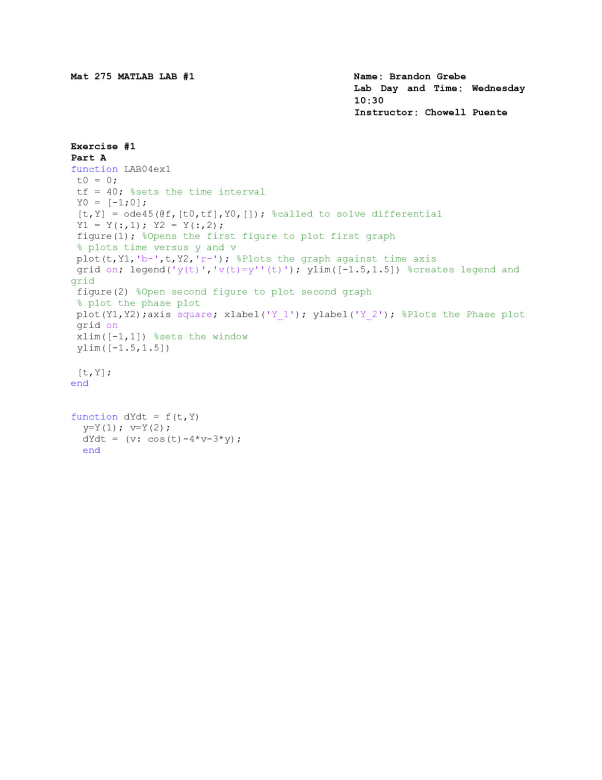
Arizona State University MAT 275 Exercise #1 Part A function LAB04ex1 t0 = 0; tf = 40; %sets the time interval Y0 = [-1;0]; [t,Y] = ode45(@f,[t0,tf],Y0,[]); %called to solve differential Y1 = Y(:,1); Y2 = Y(:,2); figure(1); %Opens the first figure to plot first graph % plots time versus y and v plot(t,Y1,'b-',t,Y2,'r-'); %Plots the graph against time axis grid on; legend('y(t)','v ...[Show More]
Access Full Document
Instant download
Preview 1 out of 12 pages
Reviews( 0 )
No Recommended Resources Yet.
| Category: | Lab Report |
| Number of pages: | 12 |
| Language: | English |
| Last updated: | 3 years ago |
| Downloads: | 1 |
| Views: | 26 |