PRACTICE QUESTIONS > Practice Exam 2.33 Stony Brook University ESG 332
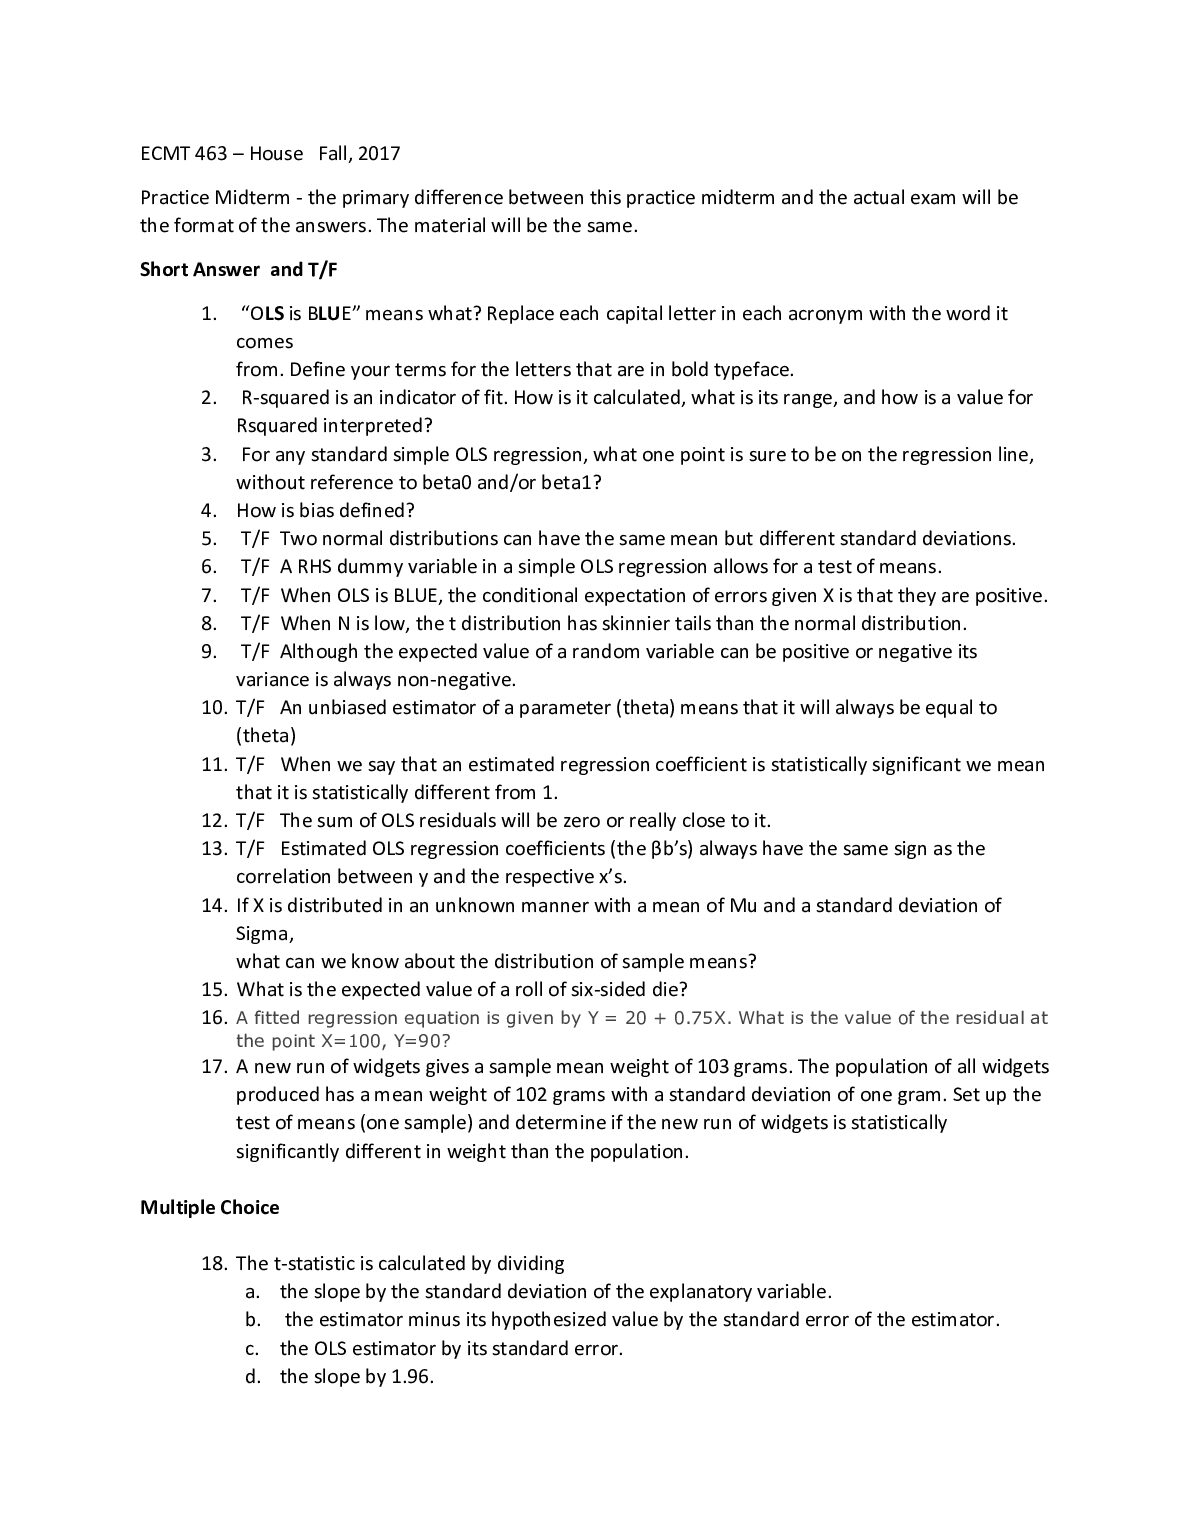
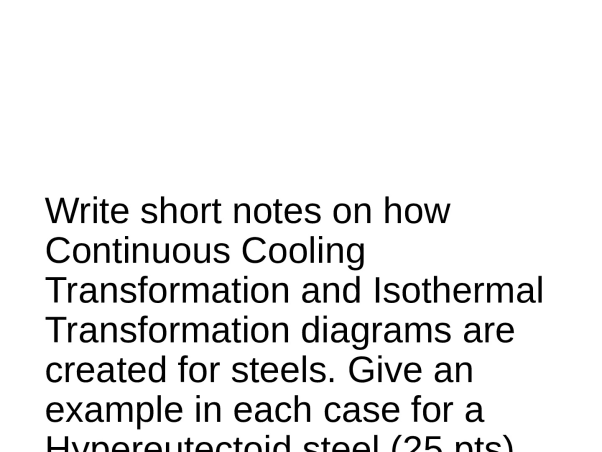
Stony Brook University ESG 332 Steps to generate an Isothermal Transformation Diagram 1. A series of S-shaped curves of % transformation vs. log of time at different temperatures is generated. 1. For each curve, data were collected after rapidly cooling a specimen from a temperature above the eutectoid temperature (i.e., from 100% austenite) to a particular temperature. ...[Show More]
Access Full Document
Instant download
Preview 1 out of 30 pages
Reviews( 0 )
No Recommended Resources Yet.
| Category: | PRACTICE QUESTIONS |
| Number of pages: | 30 |
| Language: | English |
| Last updated: | 3 years ago |
| Downloads: | 3 |
| Views: | 12 |